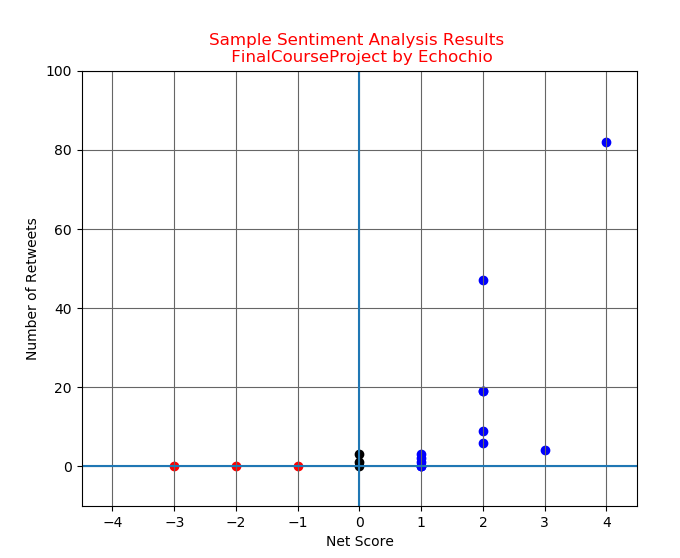
python 的 matplotlib
2020-06-11
我在密大的作業 … 檔案在下面網址
https://raw.githubusercontent.com/echochio-tw/echochio-tw.github.io/master/images/txt/project_twitter_data.csv
https://raw.githubusercontent.com/echochio-tw/echochio-tw.github.io/master/images/txt/positive_words.txt
https://raw.githubusercontent.com/echochio-tw/echochio-tw.github.io/master/images/txt/negative_words.txt
運算程式 :
punctuation_chars = ["'", '"', ",", ".", "!", ":", ";", '#', '@']
# lists of words to use
positive_words = []
with open("positive_words.txt") as pos_f:
    for lin in pos_f:
        if lin[0] != ';' and lin[0] != '\n':
            positive_words.append(lin.strip())

negative_words = []
with open("negative_words.txt") as pos_f:
    for lin in pos_f:
        if lin[0] != ';' and lin[0] != '\n':
            negative_words.append(lin.strip())

def strip_punctuation(string):
    for i in punctuation_chars:
        string = string.replace(i,'')
    return string

def get_pos(string):
    d = 0
    a = string.split()
    for i in a:
        s = strip_punctuation(i)
        s = s.lower()
        if s in positive_words:
            d = d + 1
    return d

def get_neg(string):
    d = 0
    a = string.split()
    for i in a:
        s = strip_punctuation(i)
        s = s.lower()
        if s in negative_words:
            d = d + 1
    return d

with open("project_twitter_data.csv") as f:
    lines = f.readlines()
    header = lines.pop(0)
    data = []
    for line in lines:
        l = line.split(',')
        data.append([l[0],int(l[1]),int(l[2]),get_pos(l[0]),get_neg(l[0]),get_pos(l[0])-get_neg(l[0])])

with open("resulting_data.csv","w") as f:
    f.write("Number of Retweets, Number of Replies, Positive Score, Negative Score, Net Score\n")
    for i in data:
        f.write("{}, {}, {}, {}, {}".format(i[1], i[2], i[3], i[4], i[5]))
        f.write("\n")
用上面資訊來畫圖 ….
import matplotlib.pyplot as plot
from matplotlib.lines import Line2D

def getdata(list):
    x1=[]
    y1=[]
    x2=[]
    y2=[]
    x3=[]
    y3=[]

    for i in list:
        if i[1] > 0:
            x3.append(i[1])
            y3.append(i[0])
        elif i[1] == 0:
            x2.append(i[1])
            y2.append(i[0])
        else:
            x1.append(i[1])
            y1.append(i[0])

    return (x1,y1,x2,y2,x3,y3)

fig,ax=plot.subplots(1,1)
plot.title('Sample Sentiment Analysis Results \n FinalCourseProject by Echochio',fontsize=12,color='r')
plot.xlabel("Net Score")
plot.ylabel("Number of Retweets")
data = [[3, 0], [1, 0], [1, 1], [3, 1], [6, 2], [9, 2], [19, 2], [0, -3], [0, -2], [82, 4], [0, -1], [0, 1], [47, 2], [2, 1], [0, 1], [0, 1], [4, 3], [19, 2], [0, 0]]
(x1,y1,x2,y2,x3,y3) = getdata(data)

ax = plot.scatter(x1, y1, alpha=1, color='red') # x < 0
ax = plot.scatter(x2, y2, alpha=1, color='black') # x = 0
ax = plot.scatter(x3, y3, alpha=1, color='blue') # x > 0
plot.xlim(-4.5,4.5)
plot.ylim(-10,100)
plot.axhline(y=0, xmin=-4, xmax=4)
plot.axvline(x=0, ymin=0, ymax=100)
plot.grid(b=True, which='major', color='#666666', linestyle='-')
plot.show()
